
Creating a Data Visualization to Search for H-1B Visa Employers
H-1B applications visualized by companies, job titles, and salary.
Summary
THE PROBLEM
The US Citizen and Immigration Services (USCIS) offers a data set about H-1B visa case submissions, however, this data is often displayed in a text or table format that results in 3 problems: difficult to quickly understand, identify trends, and personalize a search.
OUR SOLUTION
Synthesizing the massive dataset into a more readily understandable, personalizeable, and cohesive set of interactive visualizations with the aim of helping inform internationals who seek U.S. employment through the H-1B visa sponsorship program.
MY ROLE
UX Researcher who developed the research strategy that included 1 online survey, 7 usability test sessions, and an analysis of our results used to direct design iterations.
TOOLS
Tableau, R, Excel

Data Preparation
Data Source: Office of Foreign Labor Certification
We used ~600,000 data points that covered variables/fields such as target employer, prevailing wage, starting salary, city, application date, etc., covering a complete history of H-1B visa applications between October 1, 2016 and September 30, 2017.
R was used to understand, clean, and process the relevant dimensions used for the visualizations.
Our talented data scientist, Rahul, did most of the data processing.
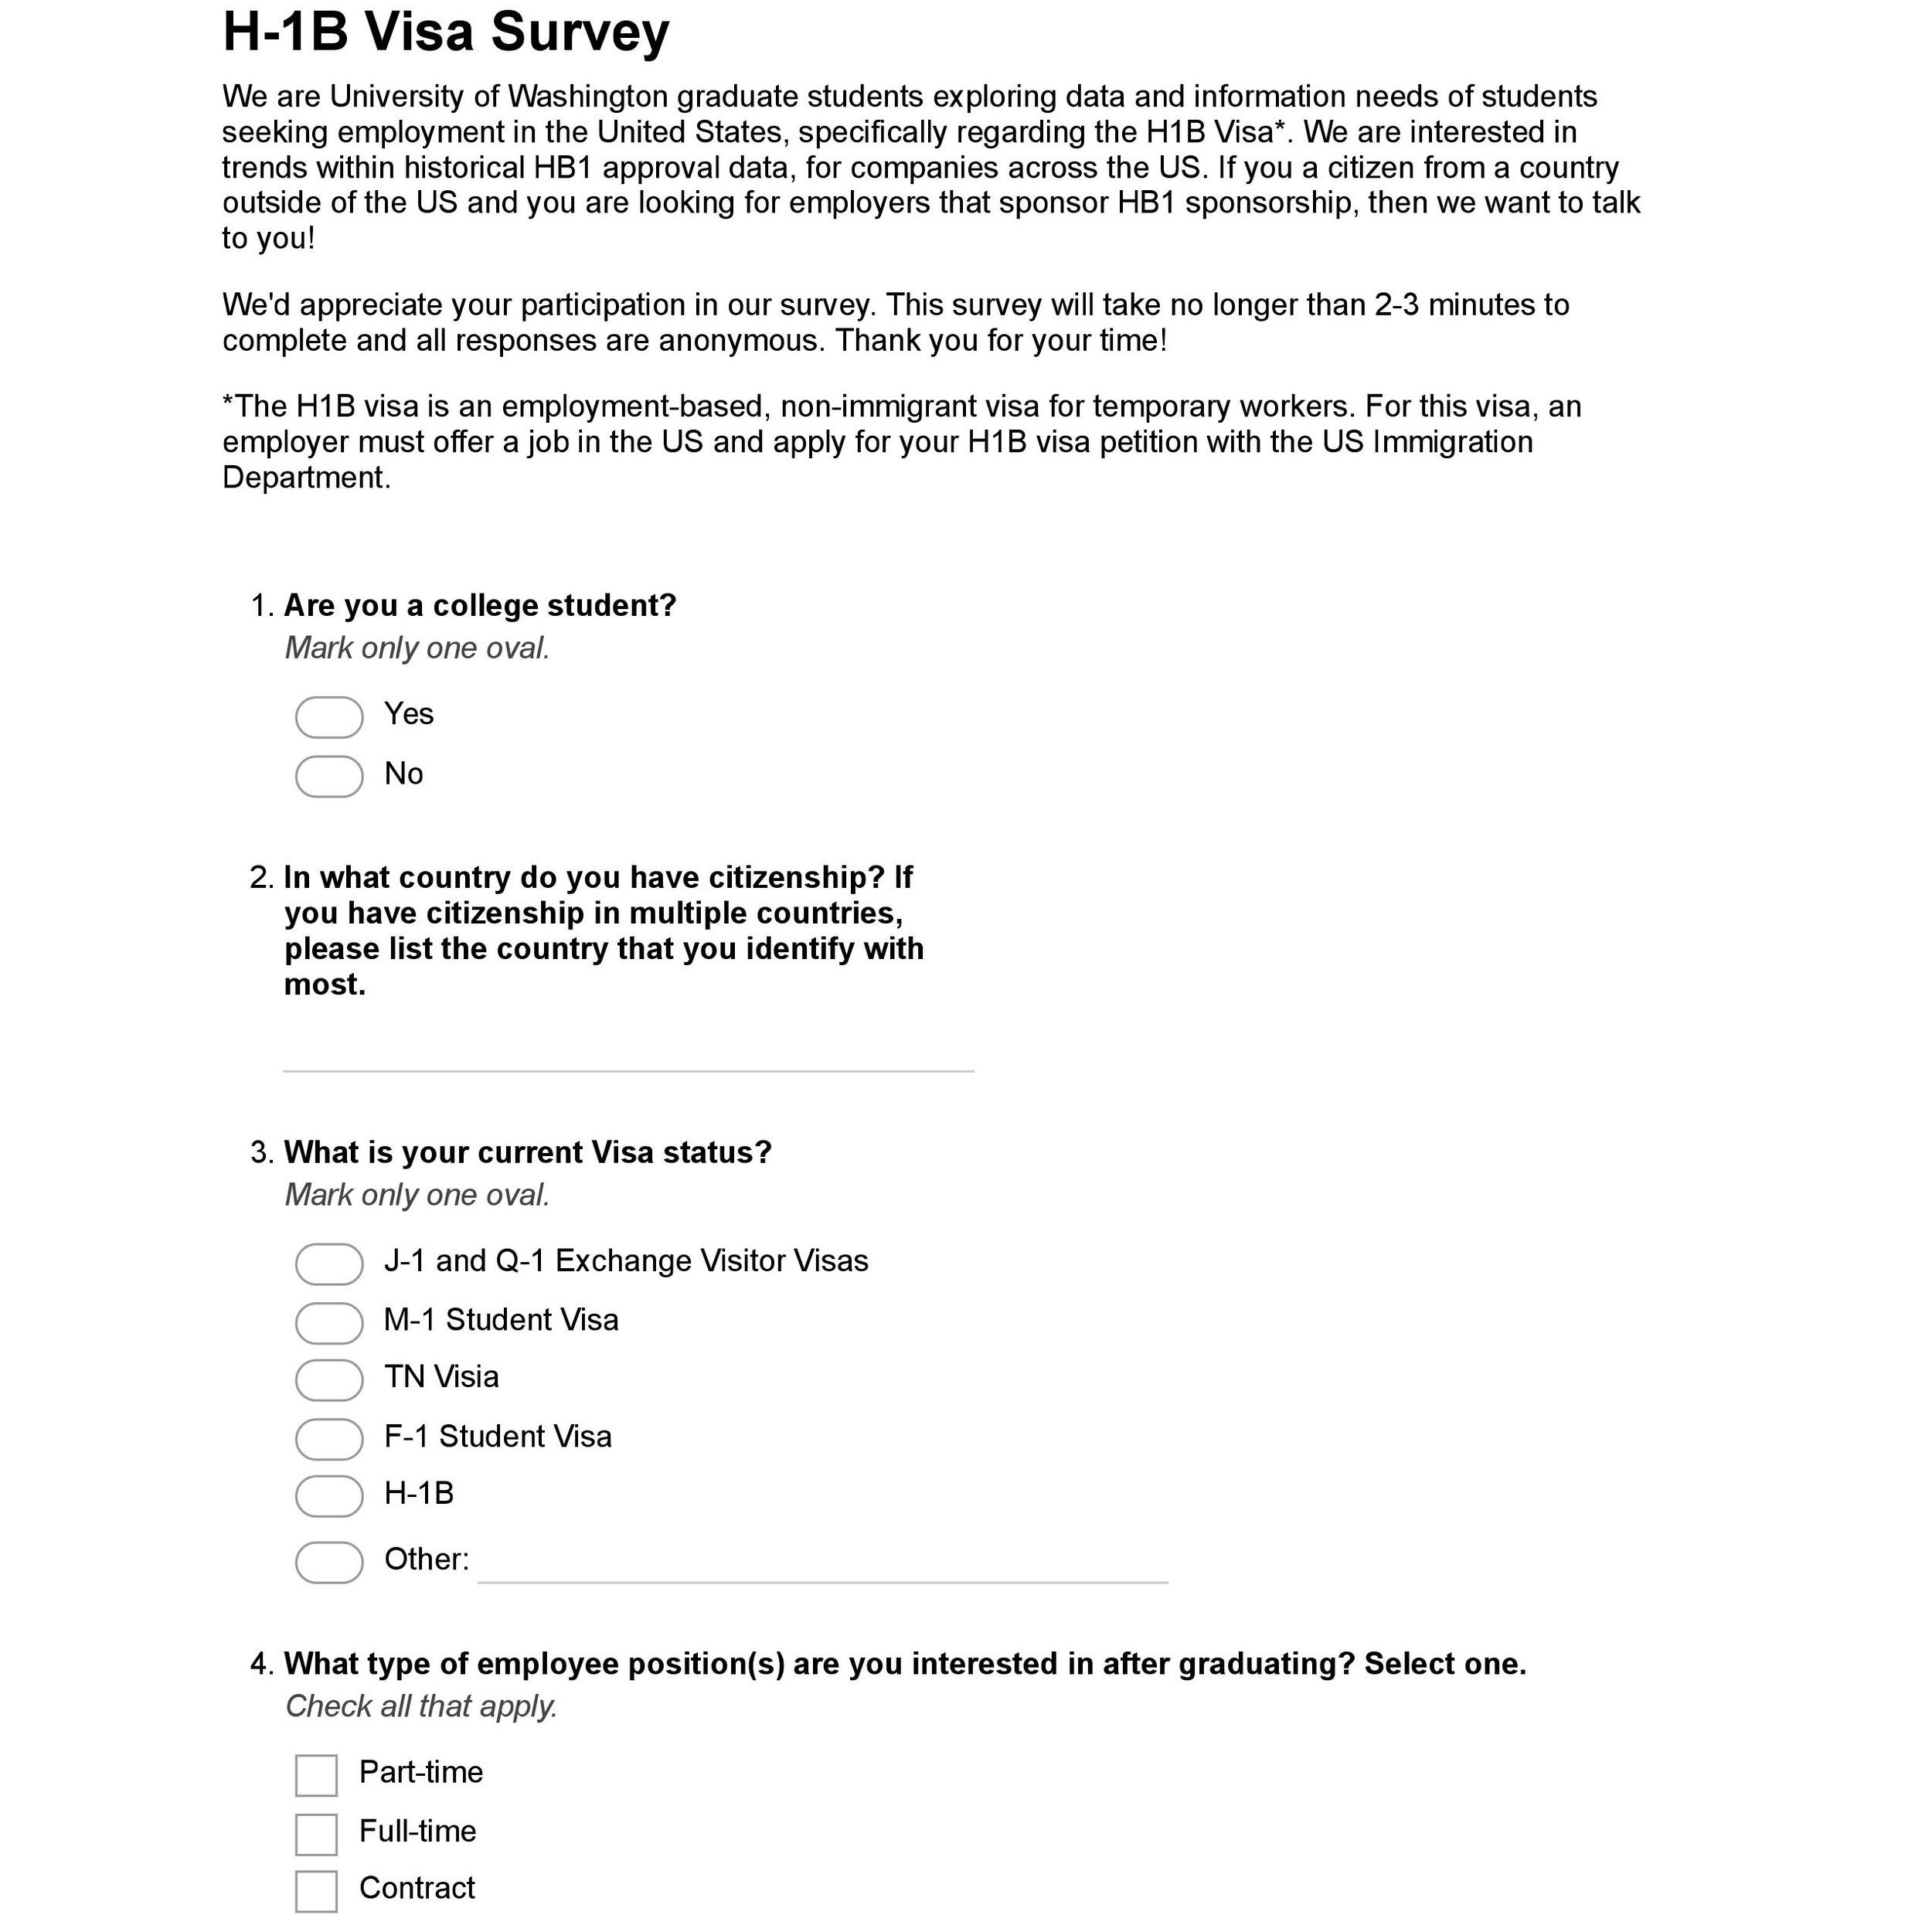
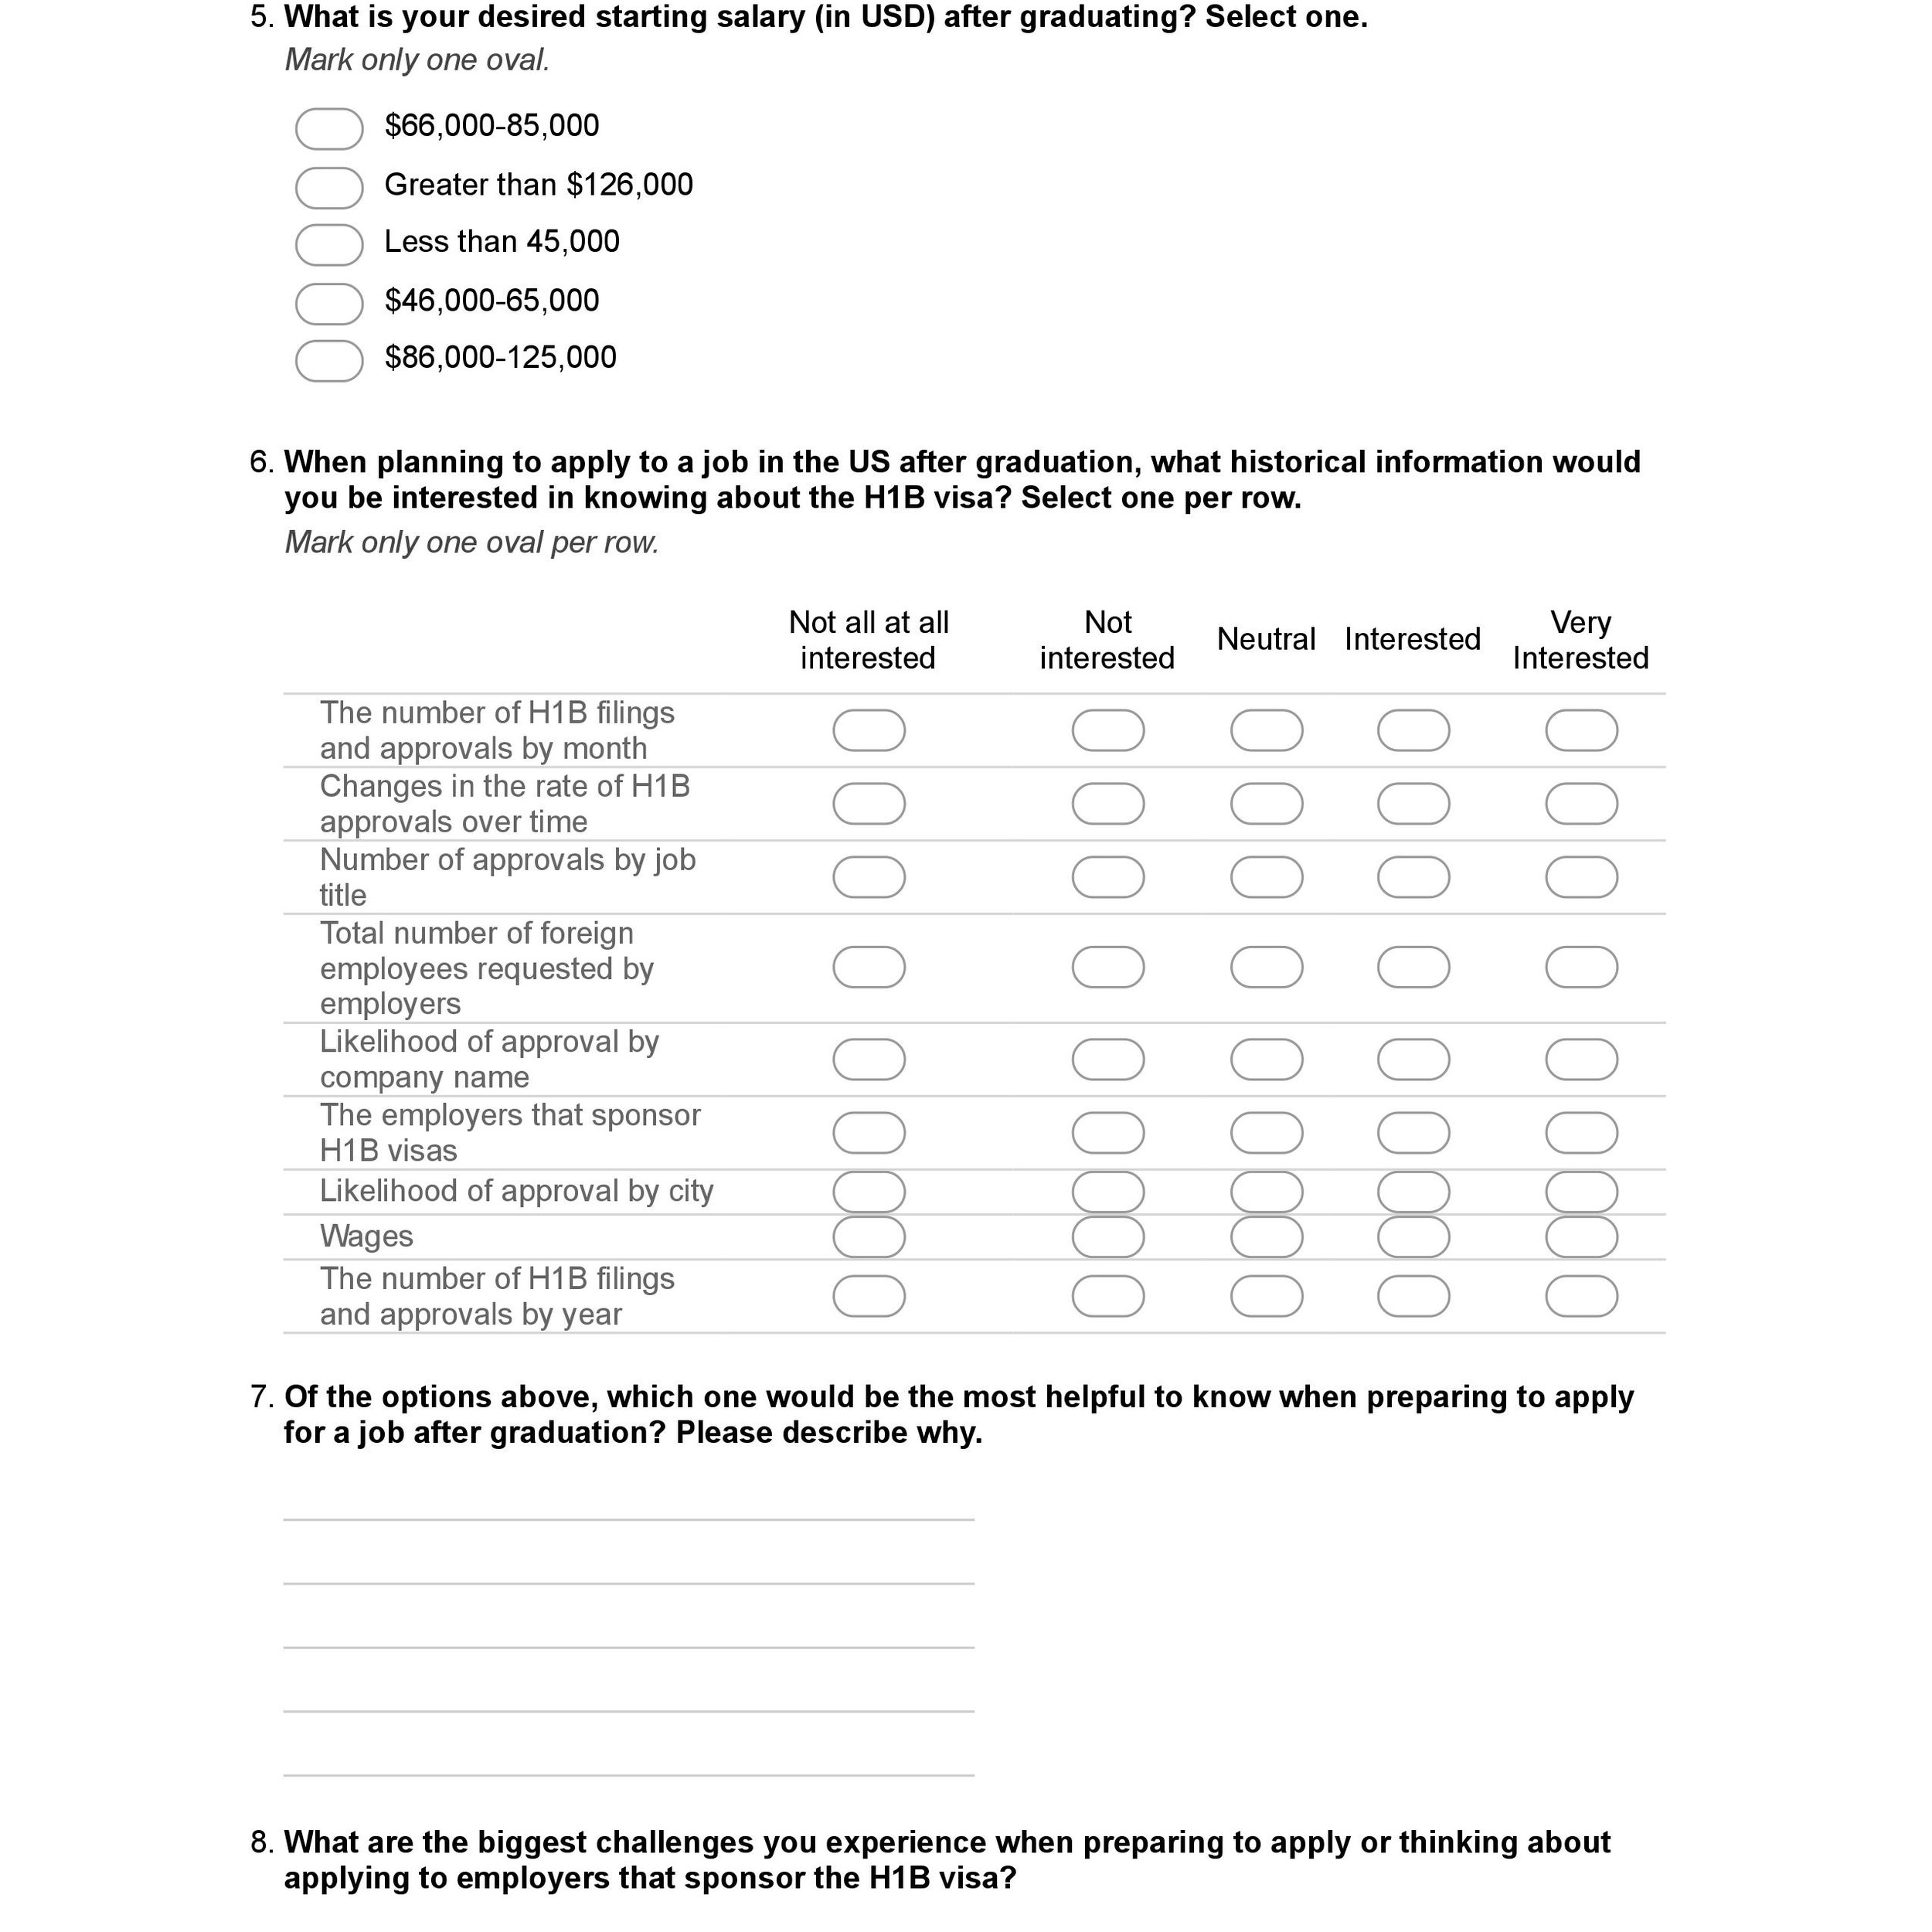
Survey
Purpose: Understand the challenges, goals, and perceptions of target users regarding H-1B applications.
Participants: International citizens planning to apply for H-1B sponsorship.
Findings:
- Participants do not know which employers have experience sponsoring H-1B.
- Participants want to know approval ratings by employer.
- Participants are interested in H-1B in H-1B case submission and approvals by job title.
- Participants fear that needing an H-1B visa will affect employability.

Usability studies
Purpose: Ensure that users could follow the story and that the visualization includes the necessary information and interactions for users to complete their tasks.
Method: 20 minute task-based think-aloud usability tests.
Participants: 7 International citizens planning to apply for H-1B sponsorship with a US employer.
FINAL OUTCOME
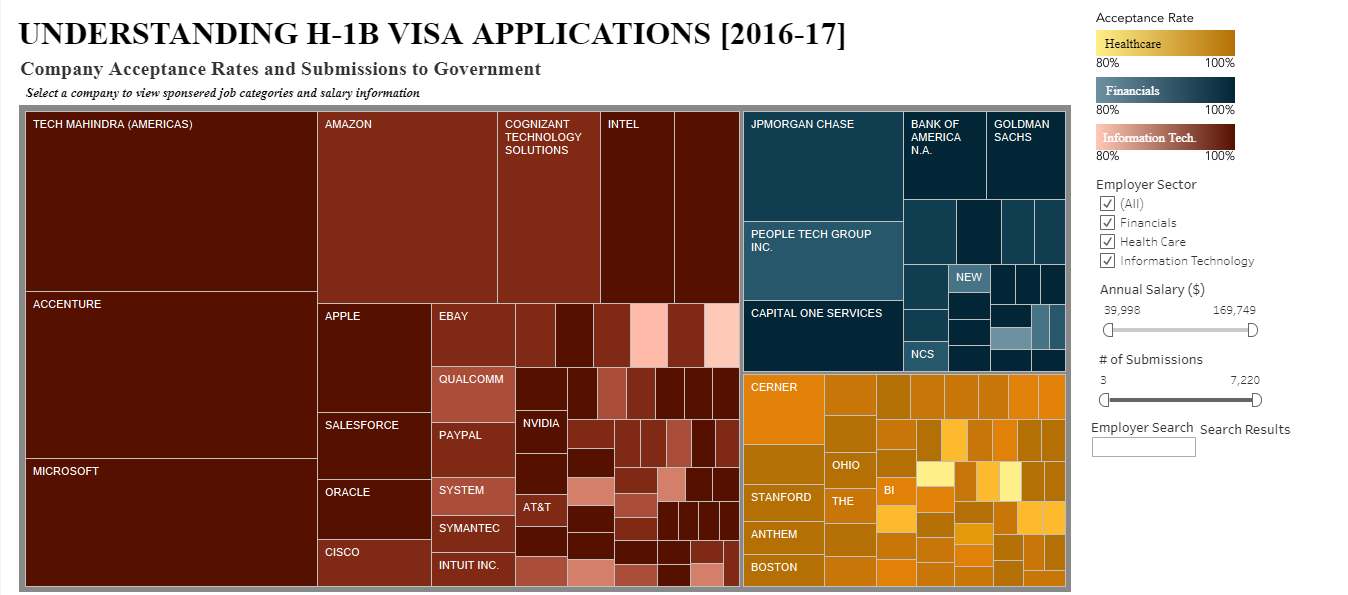
DASHBOARD 1
Company Acceptance Rates and Submissions
- Acceptance rate by color value.
- Number of applications submitted to the government by area.
- The Treemap is organized by the top three industry sectors and allows users to filter based on the industry sector, number of submissions, and annual salary of company.
- Search by employer feature.
- Hover details like number of submissions, acceptance rate, and average salary across all jobs for that company.

DASHBOARD 2
Job Categories
- View job categories for the company selected in the Treemap (from Dashboard 1).
- View the number of applications submitted for job categories.
- Compare average salary between categories.
- Hovering over job categories (blue bars) changes the adjacent Dashboard 3 (Expected vs. Actual Salaries).

DASHBOARD 3
Expected vs. Actual Salaries
- Lets users compare salaries across companies and industries, for a specific job category.
- Users can compare the average starting salary to the prevailing wage for the job. This is shown by the vertical distance from the data point to the grey line (prevailing wage).
- Prevailing wage is a labor statistic provided by the government that represents average wage for similar jobs in the surrounding geographic location; each company has a unique prevailing wage and is responsible for providing a salary of at least that value when sponsoring H-1B.